

BARC and Eckerson Group today published the results of the new topical survey Strategies for Driving Adoption and Usage with BI and Analytics. Based on a user survey of 214 companies, the study focuses specifically on the adoption, usage, and value of business intelligence (BI) and analytics tools, and generally on the effectiveness of data & analytics programs. The study is available for download free of charge thanks to sponsorship by insightsoftware, Logi Analytics, MicroStrategy, Tableau and Toucan Toco.
- The percentage of employees actively using BI/analytics tools is currently 25% on average, reflecting minimal growth in the past seven years we’ve been tracking this metric.
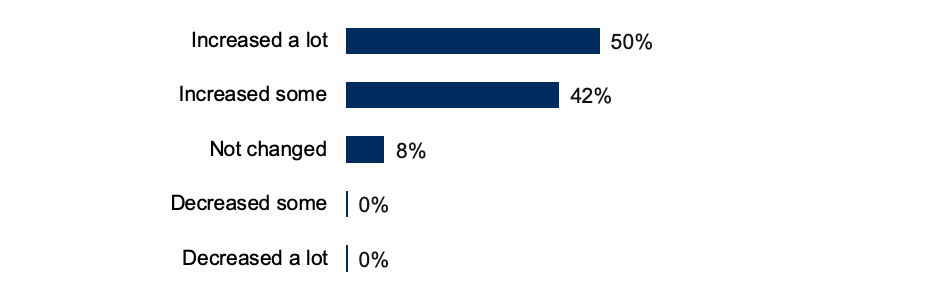
- At the same time, 50% of data & analytics leaders say BI/analytics usage has “increased a lot.”
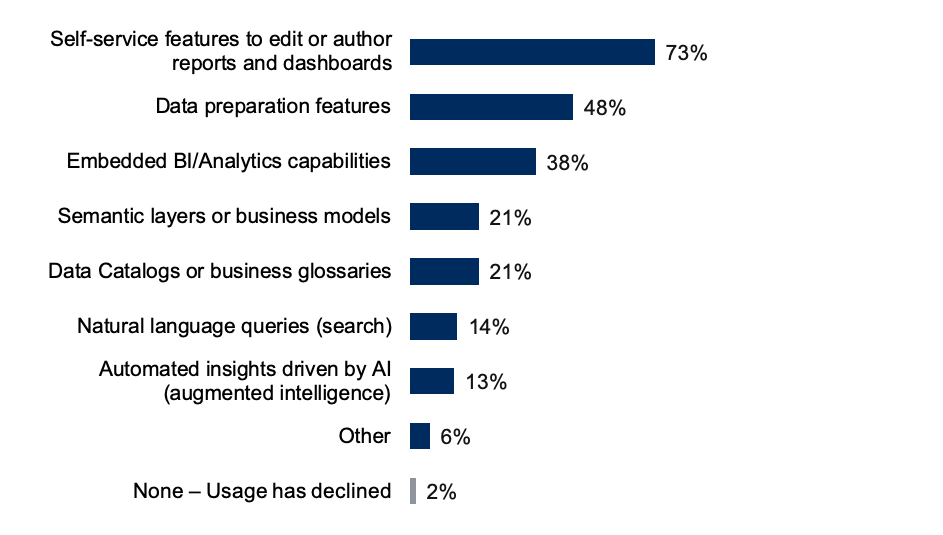
- The primary technical drivers of increased usage are “self-service authoring tools” (73%), data preparation tools (48%), and “embedded BI/analytics” (38%).
- Key business drivers of increased usage are “change in data culture” (51%), “new data-driven executives” (50%), “digital transformation or other strategic initiatives” (50%).
According to a new survey conducted by BARC and Eckerson Group, usage of BI/analytics tools is increasing while adoption rates remain stuck. “We’re puzzled by the persistently low adoption rates of BI/analytics tools,” said Wayne Eckerson, founder of Eckerson Group and co-author of the study.
“On one hand, today’s organizations are hungry for data to fuel digital transformations, modernize supply chains, and create 360-degree views of customers. And the cloud has made BI and analytics tools easier to use, install, and maintain. Yet, the average adoption rate of tools designed to help business users query, visualize, and analyze data and share insights has been stuck around 20% for many years.”
Good news: Usage of BI/analytics output is growing, fueled by several trends
The picture gets rosier when we ask data & analytics professionals to describe trends in BI/analytics usage rather than count the number of employees and licensed users, which is how we calculate adoption rates. Almost all (92%) of respondents said usage of their BI/analytics tools has increased in the past five years, with a whopping 50% saying it has “increased a lot.” Clearly more users are using BI/analytics output, such as charts, tables, and dashboards, if not BI/analytics tools themselves.
“Usage growth is primarily fueled by “off-license” usage from front-line workers using BI/analytics output embedded in operational applications as well as external users (e.g., customers and suppliers) using external-facing reports and dashboards,” said Dr. Carsten Bange, founder and managing director of BARC and co-author of the study.
North American companies adopt new technologies faster than their European counterparts
When we asked respondents to explain the growth in usage, a few clear winners rose to the surface. Self-service capabilities took the two top spots. Almost three-quarters (73%) of respondents cited “self-service authoring tools for reports and dashboards”, while almost a majority (48%) mentioned “data preparation features.” This was closely followed by “embedded BI/analytics capabilities” selected by 38% of respondents.
Other choices included “semantic layers” (21%), “data catalogs and business glossaries” (21%), “natural language queries” (14%), and augmented BI features (13%).
North American and European respondents registered similar scores for all technical features except one: embedded BI/analytics. Here, 51% of North American respondents said embedded BI/analytics has increased usage compared to just 32% of Europeans. North Americans are much more likely to have a majority of their employees (i.e., between 51% and 75% of all employees) viewing embedded charts and tables than Europeans by a ratio of 23% to 15%. Many more European respondents said zero employees at their organizations used embedded BI/analytics output than North Americans (12% to 3%).
We see other notable differences when we compare the usage of technical features of North American to European companies. For data catalogs, the usage ratio between North American and European companies is 29% to 17%; for natural language queries, 20% to 13%; and for augmented intelligence, 20% to 10%. These results reinforce the notion that North American companies adopt new technologies faster than their European counterparts.
")