
The Contrast Between Purchase Reasons and Realized Benefits
A comparison of the reasons for selecting BI and analytics tools with the resulting benefits shows that some frequently cited purchase reasons have less influence on long-term success than is often assumed.
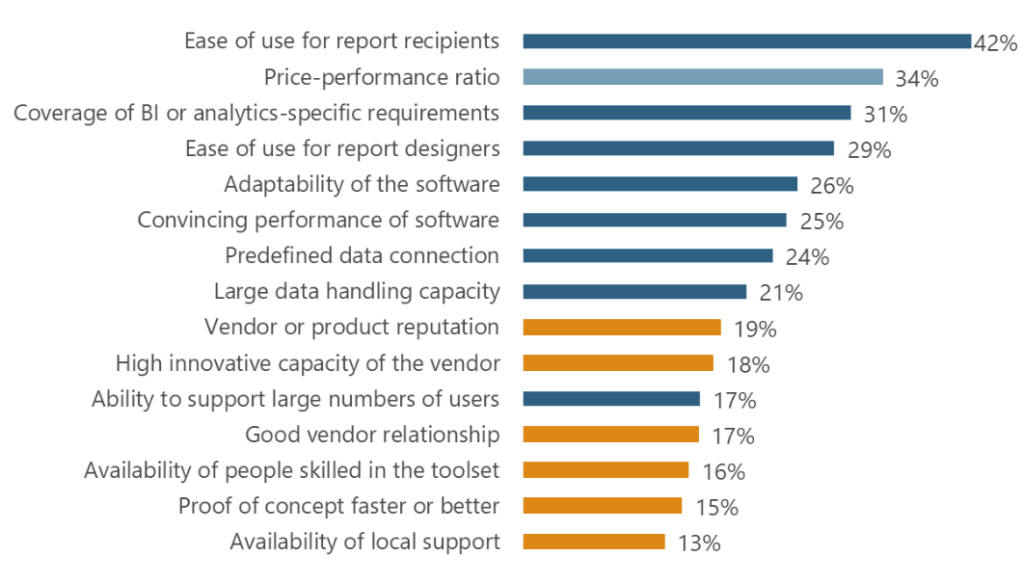
Prioritizing Price-Performance Ratio
The price-performance ratio is often a decisive purchasing motive (34 percent – see Figure 1). As the market for BI and analytics is very dynamic and many features are available in almost all leading tools, this aspect is becoming increasingly important, especially for buyers without highly specific requirements. At the same time, good coverage of specific BI/analytics requirements (31 percent) and ease of use for report recipients (42 percent) are important criteria. The adaptability of the software (26%) enables a broader range of requirements and use cases to be covered.
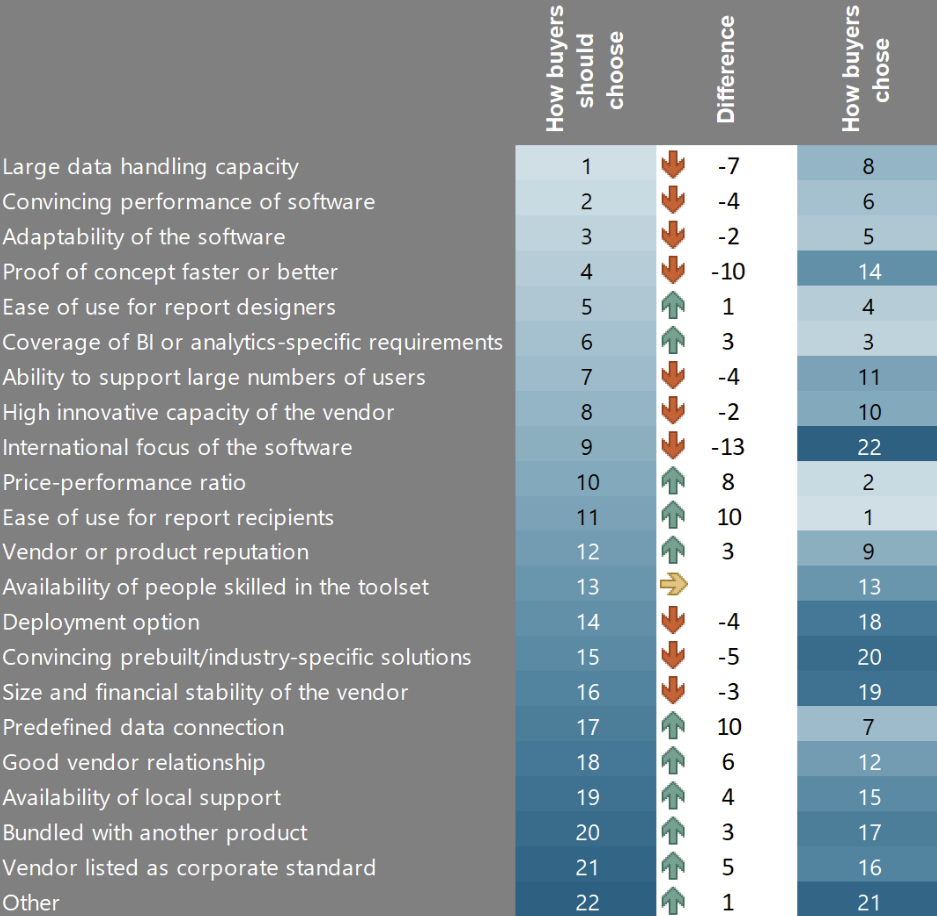
Discrepancies in Buyer Priorities and Benefits
Based on the detailed questions and results of the BI Survey 24, the stated reasons for purchase can be compared with the actual benefits achieved (Figure 2). For example, the ability to process large volumes of data offers the highest business benefit, but is not among the top five purchase priorities. Similarly, software performance ranks second in terms of business benefit, but is outside the top five in purchasing decisions. The international focus of the software is often underestimated, but is of great importance in terms of business benefits.
Vendor Performance in Proof-of-Concept Evaluations
The research stresses the need for buyers to evaluate vendors’ performances thoroughly, especially in supporting international deployments and handling non-English character sets. The variation in vendor support for language preferences in interfaces and documentation is a significant factor in BI and analytics adoption.
Misplaced Focus on Price and Ease of Use
Despite being the second most cited priority, the price-performance ratio has less impact on long-term success, especially for smaller deployments. Similarly, while ease of use for report consumers is a top priority, it doesn’t necessarily correlate with future benefits. This calls for a shift in focus towards product-related criteria over cost.
Evolving Evaluation Criteria in Recent Years
Newer evaluations tend to underestimate the importance of technical aspects like data handling capacity and software performance, which are key to deriving benefits. The growing trend of prioritizing price and predefined data connections contradicts BARC’s recommendations based on two decades of The BI & Analytics Survey.
Conclusion
This research highlights a significant gap between the factors driving BI and analytics software purchases and the actual benefits realized. Buyers are advised to consider long-term success and align their purchasing criteria with the features that genuinely contribute to business benefits. By focusing more on product capabilities and vendor support, especially in international contexts, businesses can make more strategic decisions that go beyond immediate cost considerations.
For those interested in exploring these insights further, the accompanying Best Practices document provides a more detailed correlation between purchase reasons and business benefits. Stay informed, choose wisely, and ensure your BI and analytics tools align with your long-term business objectives.
Related Links